Sample Excel spreadsheet. Instructions below:
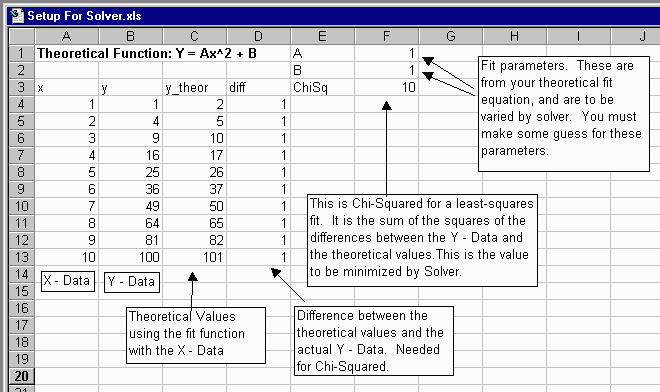
1. Setup your spreadsheet in a similar fashion to the example:

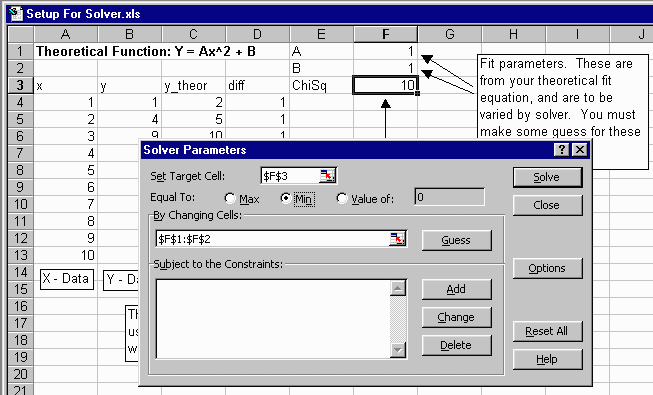
Choose Solver from the Tools menu. If it is not there, you may need to click on add-ins. If not there, you will need to try the Excel/Office setup disk. When the Solver window opens, you want to minimize ChiSq, so set that as your target cell, and choose the Min option. In order to minimimze ChiSq (the difference between your data and your fit function), you need to vary the parameters in your fit function, so in the By Changing Cells option, you need to give it the range of cells with your fit parameters. Everyhting else can be ignored for now, and when you click Solve, Excel will vary your fit parameters to the best possible values within its means.

You will want to check the fit by plotting your Y - Data and your theoretical (fit) function together. If it doesn't look like a good fit, you may need to go back to correct errors, or you may need to play with some of Solver's other features.