While Lab #0 was not a formal lab, did not require a formal writeup, I have decided to write an example of a formal writeup for it. Feel free to be creative, draw pictures, or write labs in your own way, just so long as you make the sections clear and keep the English proper. Try for the following: stay clear and concise, and do not try to use scientific jargon if you do not really understand it. I will correct grammar, spelling, etc.
Peter Sheldon
Partners: Paul Irwin, Tom Michalik
9/10/98
Lab #0 - Observations of Motion of the Big, Fuzzy,
Red Ball.The purpose of this lab is to describe the motion of a ball which is moving in a simulation. The purpose should address the experiment itself, and should be freestanding (does not require the reader to have read the lab.)
Since we did not veer from the apparatus (a computer simulation) and procedure (plot the motion in Excel, describe it in words) set out in the manual, we need not say anything here but: see lab procedure at http://physics.randolphcollege.edu/lab/1115lab/lab0.
Data:
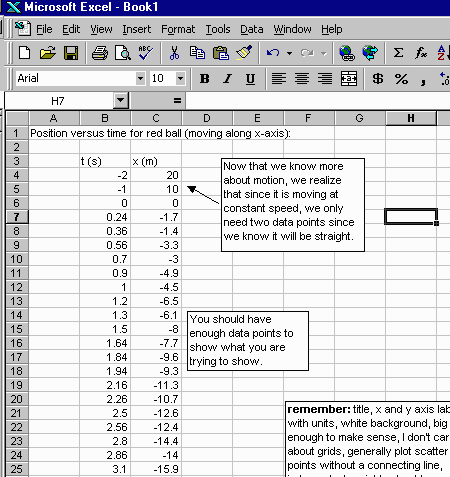
Position of the ball versus time is shown here and in the Excel data sheet. This section has raw data. Be sure to include all necessary measurements that lead to your results. Do NOT take a screen shot of your tables and plots, but instead copy and paste them directly.

Plots:
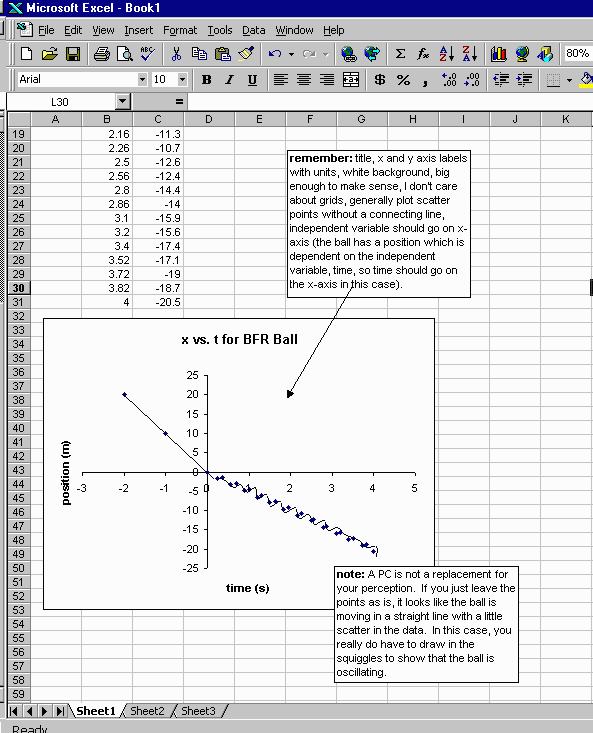
We plotted the position of the ball versus time, also attached in the Excel spreadsheet.

Results/Analysis:
This is where you would show all of your calculations, error analysis, and therefore results. You must show enough work so that I could go back and check your results.
We are measuring distance in meters. We observed that the red ball moved at constant speed to the left (-x direction) for the first 2 seconds, moving 20 m. The ball then began to oscillate back and forth about its position as it still moved forward at a slower average speed (covered another 20 m in 4 seconds). Each oscillation persisted for about 0.26 seconds over a distance of about 2 m.
Conclusions:
We described the motion of the ball in the results section. (It is usually prudent to reiterate the pertinent results with appropriate error here, but I will not for this lab.) We have also plotted this motion on a graph in a representative way so that you can look at the graph and understand the motion of the ball. (You would not usually make a statement like this last in a conclusion - the graph usually leads to the results. In this case, the graph addresses the purpose directly. The conclusion should be a restatement of the results pertinent to the purpose and the words should address whether you were able to fulfill that purpose.)
Normally your conclusion includes a numerical result: You must restate your pertinent results in the conclusion. e.g., even if you had it in another section, state your predicted range vs. your actual range, and briefly state how they compared. Be sure to use ninety percent confidence intervals and be sure to have correct significant digits.
Questions/Postlab:
If there were additional questions asked in the lab, and they did not fit in with the conclusions, then the answers should go here.