Lab Motion and Error
Procedure
Please note: the motion sensors we are using in lab today are pretty
sensitive, so be patient with them; in some cases we might have to fiddle around
with them to get them to read what you want them to read.
You have three tasks for this lab. In all the cases, you are trying to
reproduce motion (physically) which is described to you.
Setup:
Obtain a sonic ranger (motion detector), and plug it into a digital input of
the LabQuest interface, which you need to attach to your PC. The motion detector can simply be placed on a
table. You need to face the detector in a direction which has a minimum
number of obstacles and at least 2 meters range.
The minimum range that the motion detector can measure is 0.5 m, so you will
always want to be at least that far away. The maximum range is supposed to
be 6 m, but is not the case with all of them. Lets figure out the range of
the meter:
-
Start LoggerPro on the computer that the
LabQuest is attached to.
-
If it does not recognize the motion
detector click Experiment, connect, and choose "com 1".
-
If it still cannot find the equipment,
make sure all of the cables are plugged firmly into the
interface, and repeat Step 2.
-
Click the setup button
 . Choose the
"collection" tab, and change experiment length to 30 seconds (or
anything you want that is long enough to do the experiment). "OK" your
way out of the setup screen.
. Choose the
"collection" tab, and change experiment length to 30 seconds (or
anything you want that is long enough to do the experiment). "OK" your
way out of the setup screen.
-
Have someone stand in front of the motion
sensor and click the Collect button (to the right of your setup
button). If you do not have a Collect button, then please ask the
instructor.
-
The person in front of the sensor should
walk toward and away from the sensor until they reach the minimum and
maximum distances. (When you reach the minimum and maximum distances,
it will no longer detect that you are moving closer or farther away.)
Procedure:
Because of restrictions of the room, you probably want to stay between 0.5
and 1.5 meters from the sensor for the experiments.
- First, lets try to move at a constant velocity. Your goal is to move at a constant speed of 0.50+/-0.05 m/s,
toward or away from the sensor (for about 1m, or more if you like).
Practice as much as you like, and when you think you have gotten pretty
close, you will save the data:
- To save the data, you need to copy the position vs time data to Excel
for analysis (we will ignore all the other data).
- The analysis of this data will be described in the Analysis section of the
lab.
- Try to reproduce this position vs. time graph qualitatively:
Simply print the best try and tape it into your lab notebook.
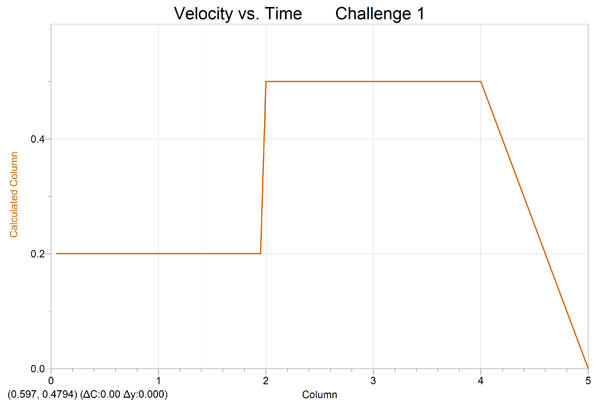
- This challenge is quantitative. Try to reproduce the velocity vs. time
graph shown below. Save your DATA (in Excel or LoggerPro or as a text file) and email it
to your lab instructor, and we will determine quantitatively who is closest
to the original, and the best reproduction will win a prize!
Also print the graph with your best try and tape it into your lab notebook.
- Please be sure to put away your motion detector and clean up around your
lab station.
Department
of Physics