Text Reference: Haliday, Resnick, Walker 16.4-16.6, 16.12-16.13, 17.2-17.3
When a wave of sinusoidal shape travels through a medium, the relationship between speed v, frequency f and wavelength l is given by the simple equation
![]() (1)
(1)
Waves having more complicated shapes may be built up by the superposition of simple sinusoidal waves of different frequencies and wavelengths.
In this laboratory you will study the behavior of waves on a vibrating string and sound waves in air by producing standing waves in both media. Standing waves are produced when you oscillate a medium of fixed length (e.g. a fixed length of string as on a guitar) at just the right frequency. The waves travel down the string and bounce back, adding together in just the right way to get the standing wave. You can see more information on standing waves here.
Scissors (not one for each group)
Electronic Balance (not one for each group)
120 Hz String Oscillator with table clamp
String, at least 1 m in length
Pulley with table clamp
Mass Hanger
Mass Sets, including the 500 g masses
Water Tube
Tuning Fork (either 1024 or 2048 Hz) & Mallet
The speed (v) of a wave on a stretched string depends upon the tension (F) and the linear mass density (m, mass/length) of the string according to
![]()
(2)
We will study wave behavior using standing waves produced by stretching a string between a vibrator (oscillating at a constant frequency (f) of 120 Hz) and a pulley, and use information about the waves to determine the mass density of the string. Weights attached to the free end of the string are used to vary the tension (F). The arrangement is shown below. The length of the string should be 1 m or more. Use Excel to record and analyze the data.
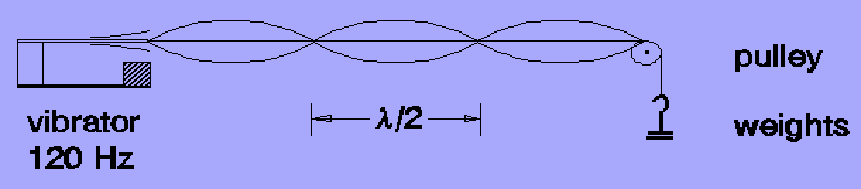
If you hang just the right mass on the string (get the right tension), the picture shows what a wave might look to you as time progresses. Normally, the string seems flat, but as you approach the right tension, you will start to observe the nodes and the maxima. As you get even closer to the critical tension by adding smaller and smaller weights, you will hear the hum of the string and see the maxima enlarge further. At this point, the pattern that you see, as observed in the diagram above, will be stable. Finally, if you pass the critical tension by adding too much mass, the maxima on the string will start to go unstable, and you will know that you have passed the critical weight and you will have to start subtracting mass. The wave seems to stand in place and oscillate up and down. Actually it moves so fast that it looks just like the picture. This is a standing wave. The pattern shown here is composed of three loops. You will notice that there are points on the string which never move (two are above the marks showing 1/2 wavelength, and then there are two more at the ends.) These points which don't move are called nodes, and this wave pattern has four nodes.
Find the values of the tension which will give standing waves with different numbers of nodes, from two to as many as you can (two nodes is one loop, three nodes is two loops, etc.) The distance between the nodes in these standing waves is one half of the wavelength. Measure this distance and use it in equation (1) to calculate the wave speed (v) for each value of tension. You will observe that the more mass you use, the fewer nodes are observed. This can be seen from the equations (fewer nodes means longer wavelength, hence higher speed, hence greater tension). You may not be able to get to just two nodes before the string breaks, but try it.
Now consider equation (2). A plot of the tension versus the square of the speed should give a straight line whose intercept is 0 and whose slope is m. Use your spreadsheet to obtain this plot; a linear regression for the slope and intercept, to 90% confidence; and be sure to add the best fit line to the graph. (Recall the use of the linest and trendline commands in Excel - see the Excel hints.)
Do your best to measure the mass of your length of string (using the digital scales - get your uncertainty from how well the sales measure the mass). From this mass and the total length of string, you can calculate the mass density of the string. To 90% confidence, how well does the slope of your graph agree with the value of m obtained by finding the actual mass per unit length?
Musical wind instruments (flute, saxaphone, etc) use standing waves in air columns to produce their sounds. Standing waves in an air column are just like standing waves on a string, except that you cannot see them. The air density oscillates, and when you oscillate it at the right frequency for a given length column, you get a pattern of nodes and anti-nodes (maxima) and you hear a single frequency. We have an analogous system using an air column inside a cylindrical tube. We will measure the properties of the standing waves in the tube in order to determine the speed of sound in air. The length of the air column can be changed by changing the depth of water in the tube (in the picture it is changed with a piston.) The presence of the standing wave is detected by listening for nodes and anti-nodes in the standing wave pattern. In our case, the oscillation is provided by a tuning fork. The arrangement is sketched below.
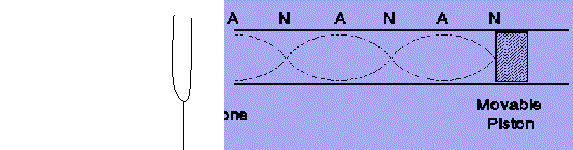
Bring the container up on the stand as far as it will go and fill the container and column until you get to within 13 cm of the top of the column. Put the minimum water needed to get the level to this point. The frequency of your tuning fork is marked on the fork. Excite the tuning fork by hitting it with the mallet. Starting with the water near the middle of the pipe, move it up or down (by moving the container up or down) until the sound is strongly reinforced. Record the position of this maximum intensity, which is found when the water level is at a node. Continue to move the container up and down, recording all the rest of the points along the tube where the sound is strongly reinforced. In all, you can expect to get only 3 maxima. Find the maxima at the upper end of the column (you should get 2). You will then have to empty out some water so you can get the maxima at the lower end of the column. Average the distances between these successive nodes, find the corresponding wavelength (which is twice the average distance), and use Eq.(1) to calculate the speed of sound in air. Because you took an average, you should be able to propagate that error so that you will have a corresponding error in the speed of sound in air.
The velocity of sound in air is known to vary with temperature as:
![]()
(3)
R = gas constant = 8.314 joules/mole K,
M = molecular weight = 28.8 g/mole for air,
T = absolute temperature, measured by reading a thermometer,
g = ratio of specific heats = 1.40 for air.
Compare your value of v measured for the standing wave with the one found from Eq.(3); in evaluating Equation 3, be sure to use all similar (perhaps MKS) units. Are your two values significantly different? Use the null hypothesis to find out. You do not need to have confidence intervals on your value from the temperature, but you should have confidence intervals from your wavelength calculation.