Lab Motion and Error
Equipment
Procedure - Qualitative
- See introduction for instructions on how to load Moving
Man. Investigate
Moving
Man by having the man move using the
sliders. Use the playback features and look at the graphs
("charts" tab at top).
-
YOU WILL NOT LEARN ANYTHING
IF YOU DO NOT DO THIS WIITHOUT USING MOVING MAN - it is okay to
be wrong here. In your lab notebook, sketch what you think
the graphs or position vs. time, velocity vs. time, and
acceleration vs. time would look like for the following scenario
and explain your reasoning.
- The man starts at the tree and moves toward the house with
constant velocity.
- Now, use the Moving Man simulation to verify or
correct your predicted graphs and reasoning with a different
color pen.
- Make new charts for each of the following scenarios. Predict
without using Moving Man what you think the graphs will
look like, and then use Moving Man to verify or correct
your predicted graphs and reasoning with a different color pen.
- The man starts three meters from the house and accelerates
towards the tree.
- The man stands still while he talks on his cell phone at the
middle of the sidewalk, then walks toward the house at a
constant rate trying to get better cell reception. He comes to a
sudden stop when the coverage is good (about a meter before the
house) and stands still to finish his conversation.
- The man starts close to the house, stands still for a little
while, then walks toward the tree at a constant rate for a
while, then the slows to a stop.
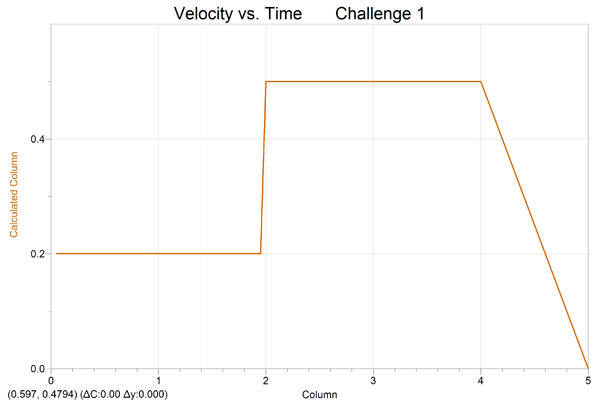
- In your lab notebook, write a possible scenario for the
following graph.
- Try to reproduce this position vs. time graph by moving the
man.
Take a screen shot of your best try and save it for your lab
notebook.
- Try to reproduce this velocity vs. time graph and take a
screen shot for your lab notebook.
Thanks to the Physics Education Technology Project for
some of the above content.
Procedure - Quantitative
Now let's say we want to move the man at a constant velocity of 5.0 +/- 0.5
m/s. Since we cannot take data from the Moving Man, we have created the same
sample data that each of you can use. Following is a real data set for time and
position of a person trying to move at the target speed. Now you want to
determine quantitatively what the speed is, and have we met the target?
Highlight this table and copy and paste it into Excel. See analysis section for
hints on this.
|
time |
position |
|
0 |
-0.25964 |
|
0.1 |
2.11667 |
|
0.2 |
1.07884 |
|
0.3 |
0.401536 |
|
0.4 |
2.722153 |
|
0.5 |
2.192121 |
|
0.6 |
4.806229 |
|
0.7 |
1.978357 |
|
0.8 |
3.285614 |
|
0.9 |
5.187828 |
|
1 |
4.378112 |
|
1.1 |
3.466131 |
|
1.2 |
6.728819 |
|
1.3 |
6.809894 |
|
1.4 |
6.627706 |
|
1.5 |
5.411035 |
|
1.6 |
7.270145 |
|
1.7 |
7.229086 |
|
1.8 |
7.52939 |
|
1.9 |
7.990802 |
|
2 |
7.920004 |
|
2.1 |
10.12775 |
|
2.2 |
11.99835 |
|
2.3 |
11.59956 |
|
2.4 |
10.45303 |
|
2.5 |
11.3355 |
|
2.6 |
13.73478 |
|
2.7 |
13.07288 |
|
2.8 |
15.09273 |
|
2.9 |
13.33351 |
|
3 |
13.07196 |
|
3.1 |
14.53654 |
|
3.2 |
14.41347 |
|
3.3 |
15.64187 |
|
3.4 |
15.36118 |
|
3.5 |
18.41745 |
|
3.6 |
16.77209 |
|
3.7 |
18.77771 |
|
3.8 |
19.67275 |
|
3.9 |
19.24326 |
|
4 |
17.29395 |
|
4.1 |
19.70274 |
|
4.2 |
19.17639 |
|
4.3 |
21.66425 |
|
4.4 |
19.7268 |
|
4.5 |
20.31847 |
|
4.6 |
22.2 |
Department
of Physics